12 E 49th St., 11th Floor, New York, NY 10017
T: +1-212.323.7000
E: info@roundtables.us

December 14, 2021
Auriemma Roundtables Debuts Enhanced Benchmarking Capabilities for Consumer Lenders
Auriemma Roundtables is pleased to announce the launch of its enhanced benchmark capabilities, signaling the company’s largest data investment since debuting VIZOR, its proprietary data benchmarking platform.
These new capabilities will empower Auriemma Roundtables’ lending clients to better drill down and analyze data, as well as highlight key trends and major industry changes. Users will also be able to customize their segmentation and export relevant charts and data sets. The new, member-only capabilities will be available to more than 25 Roundtable groups, covering several operational areas including Collections, Customer Service, Fraud Control, and more.
The new tools provides exclusive industry data insights while saving organizations time, effort, and analyst hours. New features include:
Executive Summary
Provides a snapshot of the benchmark’s most important metrics and a comparison of how a member organization is trending versus the segment (industry, peer group, etc.).
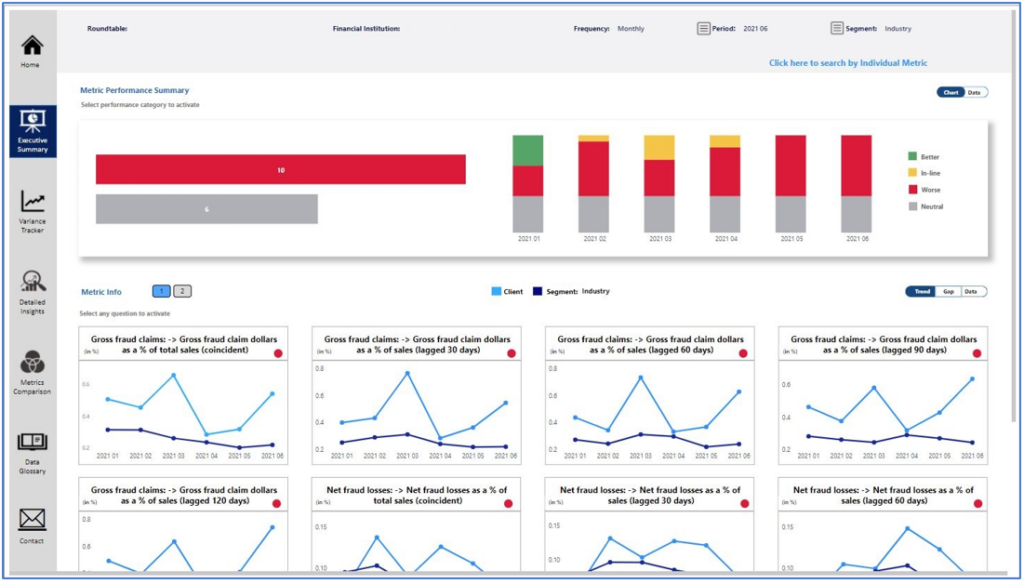
*All data is fictitious and used for illustrative purposes only
Variance Tracker
Showcases the metrics that moved most significantly from a prior period (e.g., month over month, quarter over quarter, or year over year). Clients can control how results are shown, (e.g., comparisons by industry, peer group), etc.
*All data is fictitious and used for illustrative purposes only
Detailed Insights
The report is interactive, with options to click into specific metric drill downs. The detailed insights will show performance at the section level to allow the user to hone in on areas of strengths and opportunities.
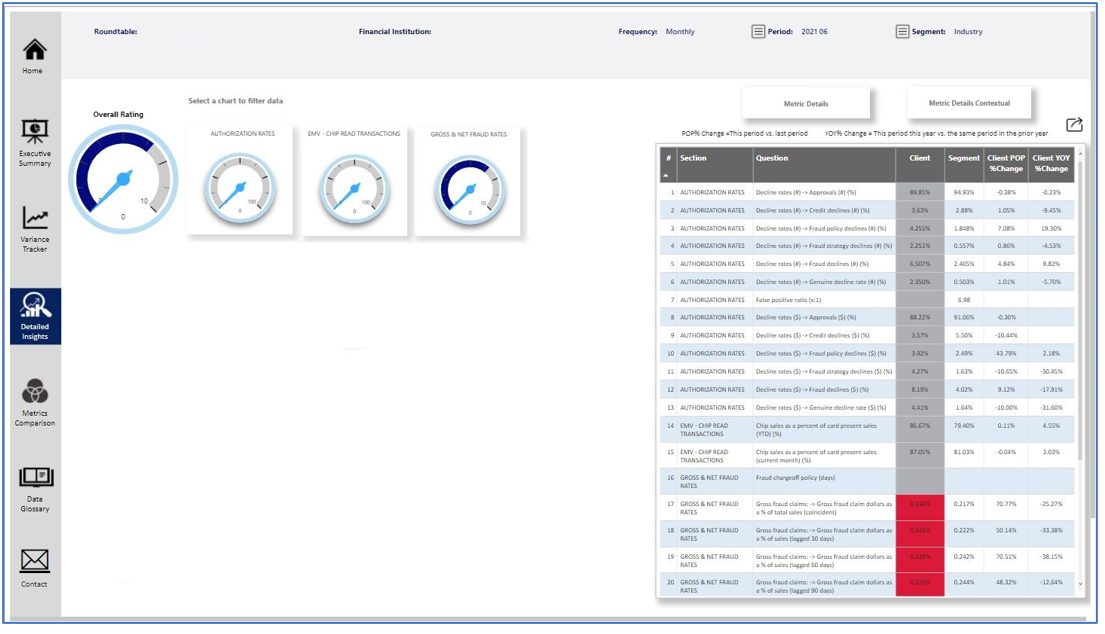
*All data is fictitious and used for illustrative purposes only
Drill Downs
A deep dive into each metric. Provides period-over-period change, trending information for client companies vs. preferred segments, individual data responses for each metric, along with client ranking in the current period. Members can select what’s displayed and toggle segments on and off to provide a customized view.
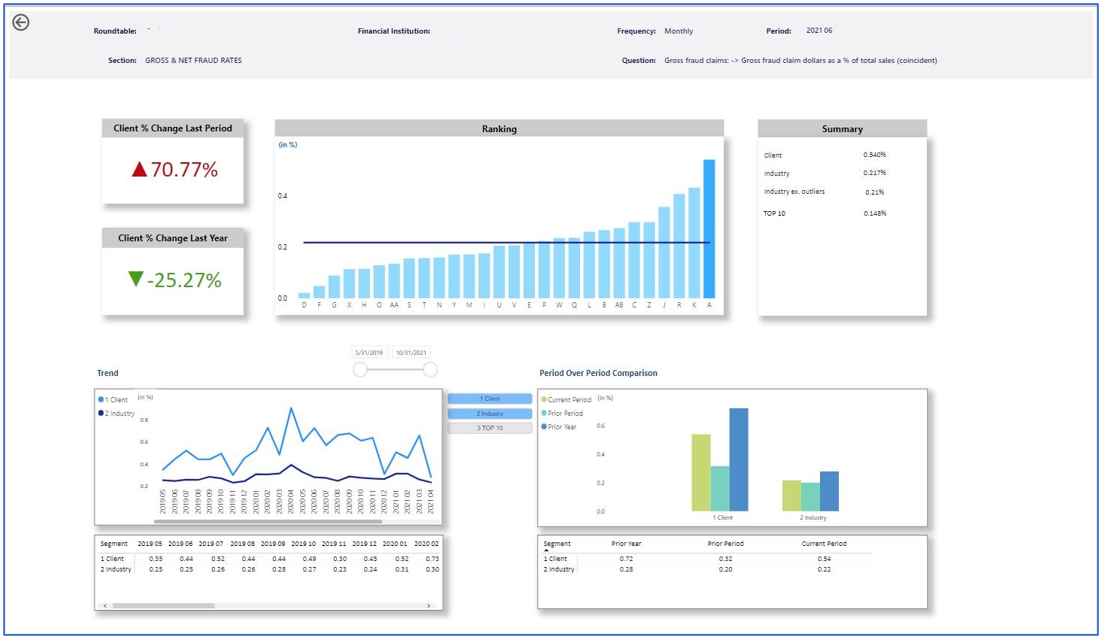
*All data is fictitious and used for illustrative purposes only
Metric Comparisons
Ability to pull in any two metrics within the benchmark into charts to identify any correlation.
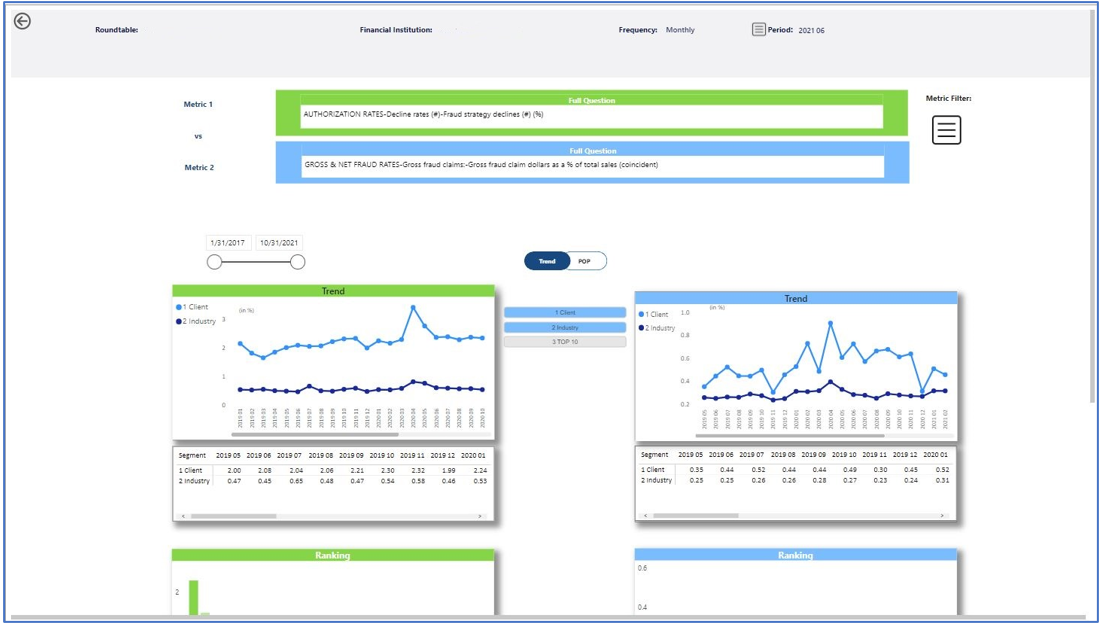
*All data is fictitious and used for illustrative purposes only
For more information or a demo, contact Mike Viola.