12 E 49th St., 11th Floor, New York, NY 10017
T: +1-212.323.7000
E: info@roundtables.us

September 15, 2026
What Chargeback Data Says About Fraud
Card issuers with comparatively smaller portfolios consistently have higher chargeback and fraud rates than larger counterparts, according to Auriemma Roundtables benchmarking data.
An issuer’s fraud exposure can take shape across transactions that initially appear unrelated. A disputed purchase, a recurring merchant, or similar activity across several accounts may be pieces of a broader pattern, with financial consequences that become clearer over time. Chargeback data can help bring those connections into view.
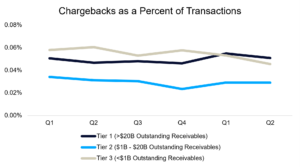
Smaller issuers – those with less than $1 billion in outstanding receivables – consistently experienced higher chargeback rates, a greater share of fraudulent transactions and higher gross fraud claim rates than their larger peers. For issuers with smaller card portfolios, understanding what individual disputes reveal about broader risk may be particularly valuable, especially when day-to-day case handling competes with the time available for deeper investigation.
Across all issuers, Auriemma Roundtables analysis found a moderately strong positive correlation (0.51) between chargeback requests and gross fraud losses at a 120-day lag. That relationship suggests chargeback activity could provide an early warning signal.
The analysis below examines how chargeback trends relate to fraud activity and subsequent losses, with a focus on smaller card portfolios. It explores how chargeback workload and investigative capacity may contribute to differences between issuer groups, and how peer benchmarking can help put those patterns into context.
Examining Chargeback and Fraud Trends
From Q1 2025 through Q2 2026, issuers with less than $1 billion in outstanding receivables recorded higher chargeback rates than mega and super-regional issuers in four of the six quarters examined.
One possible explanation is differences in dispute-resolution capacity. Smaller card programs operating with leaner teams or fewer automated tools may have fewer opportunities to resolve disputes before they become chargebacks.
That can create a downstream challenge. Higher chargeback rates mean more cases to handle relative to transaction volume. For teams with limited capacity, processing those requests may leave less time to connect related cases, investigate recurring activity and identify potential dispute abuse. Where those patterns remain undetected, additional fraudulent activity and losses may follow.
Source: Auriemma Roundtables Card Chargeback Benchmark
This also helps explain why the composition of chargeback requests matters, even when the overall rate remains relatively steady. Transaction details and investigation outcomes can reveal whether requests involve isolated issues or recurring patterns with broader fraud implications. Connecting that information can help smaller issuers understand where chargeback activity may be signaling additional exposure.
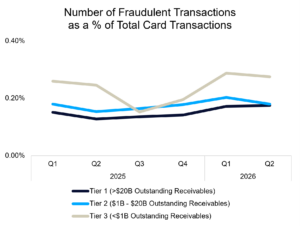
That potential strain on investigation capacity becomes more consequential when viewed alongside the fraud transaction data. Smaller issuers recorded higher fraud transaction rates than both larger cohorts in five of the six quarters examined, pointing to a recurring pattern of elevated exposure.
Fraud transaction data underscores the exposure. Smaller issuers recorded higher fraud transaction rates than both larger cohorts in five of the six quarters examined.
Across Q1 2025 through Q2 2026, fraudulent transactions averaged approximately 0.24% of total card transactions among issuers with less than $1 billion in outstanding receivables, compared with 0.18% for the middle cohort and 0.15% for the largest issuers. The smallest issuers’ average was about 33% higher than the middle cohort and roughly 60% higher than the largest.
This may point to a recurring gap in fraud exposure relative to card activity, adding context to the potential warning signals within their chargeback data.
Source: Auriemma Roundtables Card Fraud Control Benchmark
“For a smaller team, keeping up with chargebacks can leave less time to step back and spot patterns across cases,” says Jaime Paz, Director at Auriemma Roundtables. “If recurring fraud or dispute abuse goes unrecognized, that activity has room to continue. That could help explain why higher chargeback rates appear alongside higher fraud transaction rates among smaller issuers.”
For example, several fraud-related requests involving similar transaction patterns across different accounts could prompt a broader investigation. Connecting those cases may help an issuer identify additional exposure and evaluate whether its controls need to change.
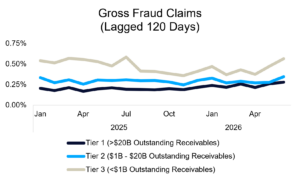
Gross fraud claims reveal another persistent gap. Issuers with less than $1 billion in outstanding receivables had higher gross fraud losses than both larger peer groups since Q1 of 2025. The consistency of that gap suggests the challenge extends beyond an isolated spike. Auriemma Roundtables’ analysis also found higher net fraud losses among the smallest issuers, meaning the gap carries through to the losses these institutions ultimately absorb.
Source: Auriemma Roundtables Card Fraud Control Benchmark
For smaller issuers, these findings strengthen the case for connecting chargeback reviews directly to fraud prevention. Identifying recurring merchants, transaction patterns or affected accounts can give fraud teams a clearer starting point for investigating additional exposure. Acting on those findings may help limit repeat activity before more transactions become claims, while tracking subsequent losses can help assess whether the response is working.
“One of the biggest opportunities is making sure what chargeback teams learn consistently reaches the people responsible for fraud prevention,” says Paz. “Those findings can inform monitoring and investigations. Tracking repeat activity and subsequent losses then helps teams assess whether their response is reducing exposure.”
About Auriemma Roundtables’ Benchmarking
Auriemma Roundtables’ benchmarking gives credit card issuers of all sizes visibility into chargeback activity, fraud transaction rates and fraud losses, both against peer segments and the wider industry.
These comparisons help issuers understand where their results diverge from peers and explore how chargeback trends relate to broader fraud exposure. Combined with operational discussion and director insights, the data provides context for interpreting performance and identifying areas for closer analysis.
Contact Jared Kirby to learn more about participating in Auriemma Roundtables’ benchmarking and exploring the peer data available for your card portfolio.